Offshore Staffing Cost-Benefit Analysis for Leaders

Most business leaders who explore offshore staffing make the same first mistake: they compare hourly rates and call it analysis. An offshore developer in India at $25/hour versus a domestic hire at $85/hour looks like an obvious win. But that math ignores ramp-up time, attrition, management overhead, and communication friction. A real offshore staffing cost-benefit analysis accounts for all of it. This guide walks you through exactly how to build one, what inputs you need, where most analyses go wrong, and how to validate your projections once the team is live.
Table of Contents
Key takeaways
| Point | Details |
|---|---|
| Loaded costs are what matter | Base hourly rates understate true offshore costs by 40–80%; always model fully-loaded labor expenses. |
| Break-even takes time | A single offshore hire typically reaches break-even between 10 and 12 weeks, not on day one. |
| Attrition erodes savings fast | Annual offshore attrition of 15–20% can reduce projected savings by 20–30% over three years. |
| Senior talent lowers total cost | Paying 25% more for senior offshore staff reduces defect cycles by 40%, cutting total cost of ownership. |
| Validate with real data | Post-deployment tracking of attrition, productivity, and management hours is what separates good analysis from guesswork. |
What goes into an offshore staffing cost-benefit analysis
Before you build a model, you need to understand what you are actually measuring. The most common error in any offshore staffing analysis is treating the base salary or hourly rate as the cost. It is not. The real number is the fully-loaded labor cost, which includes salary, statutory benefits, bonuses, equipment, software licenses, and any employer-side taxes or contributions.
Once you have that baseline, you layer in the costs that most spreadsheets omit entirely.
The hidden cost categories you must include:
-
Ramp-up productivity drag. A new offshore hire typically operates at 40–60% productivity for the first 6–10 weeks while they learn your systems, codebase, and processes.
-
Attrition and replacement. Offshore attrition averages 15–20% annually, and each replacement resets the ramp-up clock.
-
Management overhead. Your onshore managers will spend real hours on async communication, code reviews, and coordination. That time has a dollar value.
-
Communication inefficiency. Async coordination with less than 4 hours of daily overlap causes 15–25% more rework, which is a direct cost.
-
Compliance and legal setup. Depending on the country, you may face local employment law requirements, data protection obligations, and payroll compliance costs.
Data inputs you need before starting:
-
Projected engagement duration (minimum 12 months for meaningful ROI)
-
Expected role-level attrition rate for your target market
-
Available management capacity in hours per week
-
Time zone overlap between your team and the offshore location
-
Fully-loaded cost of your equivalent domestic hire
Pro Tip: Build your model in two versions: one using your vendor’s quoted rate and one using a fully-loaded estimate. The gap between those two numbers is your risk exposure if assumptions do not hold.
The table below outlines the core inputs and what each one feeds in your model.
| Input | What it affects |
|---|---|
| Fully-loaded offshore salary | Base cost comparison |
| Ramp-up duration and productivity % | First-quarter cost accuracy |
| Annual attrition rate | Three-year savings projection |
| Management hours per offshore FTE | Overhead cost calculation |
| Daily overlap hours | Rework and quality cost estimate |
| Compliance and legal setup costs | Year-one total cost |
How to run the analysis step by step
With your inputs assembled, here is how to build a model that actually holds up to scrutiny.
-
Calculate fully-loaded costs on both sides. Take your domestic hire’s total compensation package including benefits, payroll taxes, and overhead. Do the same for the offshore hire. Offshore staffing delivers 40–70% savings on fully-loaded labor costs compared to domestic hiring, but that range widens or narrows significantly based on role seniority and location.
-
Model ramp-up productivity loss. Multiply the offshore hire’s monthly cost by the productivity deficit percentage for each ramp-up week. A hire at 50% productivity for eight weeks is effectively costing you four weeks of full output at full pay. Add that to your year-one cost.
-
Project attrition-driven replacement costs. If attrition is 18% annually and you have a team of ten, expect to replace roughly two people per year. Each replacement carries recruiting fees, ramp-up costs, and a productivity gap. Annual 15% attrition can reduce projected savings by 20–30% over three years. Model this explicitly.
-
Quantify management and communication overhead. Estimate how many hours per week each onshore manager spends on offshore coordination. Multiply by their hourly rate. Research shows communication overhead adds roughly $450/week per offshore engineer when time zone overlap is limited.
-
Run a break-even analysis. Plot cumulative offshore costs against cumulative domestic costs month by month. The point where the gap turns positive is your break-even. For a single offshore engineer, break-even typically occurs at 10–12 weeks. For a team, it shifts based on ramp-up staggering and attrition assumptions.
-
Compare offshore against nearshore and onshore alternatives. This is where the choice between offshore and nearshore becomes a real decision, not just a cost question. Nearshore options cost more per hour but reduce communication friction and rework. The right staffing cost comparison depends on your project’s collaboration intensity.
Pro Tip: Run your break-even model at three attrition scenarios: 10%, 18%, and 25%. If the analysis only works at the optimistic end, your decision is riskier than it looks.
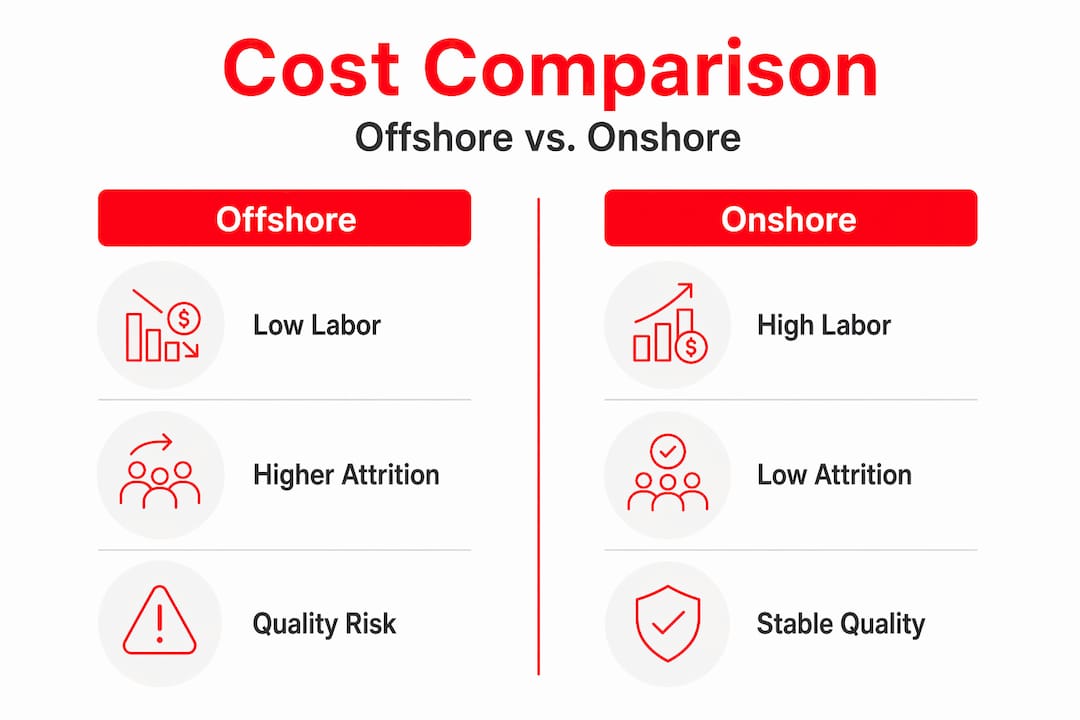
| Cost driver | Offshore | Nearshore | Onshore |
|---|---|---|---|
| Base labor cost | Low | Medium | High |
| Communication overhead | High | Low to medium | Low |
| Ramp-up productivity loss | Medium to high | Medium | Low |
| Attrition risk | High | Medium | Low |
| Compliance complexity | High | Medium | Low |
| Realistic year-one savings | 30–50% | 15–30% | Baseline |
Common mistakes that distort your analysis
Even well-intentioned analyses produce misleading results when key variables are mishandled. Here is where most offshore workforce cost analyses break down.

Relying on base rate comparisons. Hidden costs add 40–80% on top of base offshore rates, and base rate comparisons overstate onshore costs by 15–20% at the same time. The double distortion makes offshore look far more attractive than it actually is in year one.
Treating attrition as a fixed assumption. Most models plug in a single attrition number and leave it there. Attrition is a variable that changes with market conditions, team culture, and management quality. If you are not stress-testing your model at different attrition rates, you are not doing an analysis. You are doing arithmetic.
Ignoring quality and rework costs. A lower hourly rate means nothing if the output requires significant rework. Factor in defect rates, review cycles, and the cost of your senior engineers’ time spent fixing problems rather than building features.
Underestimating regulatory complexity. Depending on where you hire, local employment law, data residency rules, and payroll compliance can add meaningful costs and delays. AI tools are also changing offshore workflows, increasing the need for governance and verification processes that carry their own overhead.
Skipping the senior talent calculation. This is the most counterintuitive mistake. Investing 25% more in senior offshore talent reduces bug-fix cycles by 40%, which lowers your effective total cost of ownership. Optimizing for the lowest hourly rate almost always produces the highest total cost.
The real question in evaluating offshore staffing is not “how much does this person cost per hour?” It is “what does it cost us to get a unit of quality output delivered?” Those two numbers are rarely the same.
Pro Tip: Before signing any offshore staffing contract, calculate the cost of your worst-case attrition scenario. If the numbers still work, proceed. If they only work in the best case, renegotiate the terms or reconsider the model.
How to validate your analysis after deployment
A cost-benefit analysis is a prediction. After deployment, your job is to measure whether that prediction was accurate and adjust accordingly.
-
Track actual attrition against your model. Set a 90-day and 180-day checkpoint. If actual attrition is running above your modeled rate, recalculate your three-year savings projection immediately. Do not wait for the annual review.
-
Measure productivity against your ramp-up curve. Define productivity benchmarks before the team starts. Story points completed, pull requests merged, or tickets resolved per sprint are all usable proxies. Compare actual output to your ramp-up assumptions at weeks 4, 8, and 12.
-
Log management hours honestly. Ask your onshore managers to track time spent on offshore coordination for the first quarter. Most teams discover this number is 20–40% higher than they estimated. Feed that real figure back into your cost model.
-
Evaluate break-even timing against your projection. If your model predicted break-even at week 11 and you are at week 16 with no break-even in sight, identify which variable is off. Is it ramp-up? Attrition? Management overhead? Pinpointing the gap tells you where to intervene.
-
Expand your ROI view beyond pure cost savings. Once the team is stable, measure scalability gains, speed-to-hire improvements, and the ability to operate across time zones. Labor cost reduction drives 34.1% of offshore sourcing decisions, but the long-term value of a well-managed offshore team often exceeds the initial cost savings by a significant margin.
My take on getting offshore staffing right
I have seen a lot of offshore staffing decisions go sideways, and the pattern is almost always the same. The initial analysis was built on optimistic assumptions, and nobody stress-tested them before signing contracts.
What I have learned from watching businesses navigate this is that the leaders who get offshore staffing right treat the cost-benefit analysis as a living document, not a one-time justification exercise. They update their models with real data every quarter. They hold vendors accountable to attrition benchmarks. And they invest in the senior talent tier rather than chasing the lowest rate on the market.
The hybrid model data is particularly compelling to me. Combining two offshore technicians with one senior local resource increases ROI by approximately 285%, while a fully offshore team can reach 387%. Those numbers suggest that the question is not offshore versus onshore. It is about finding the right ratio for your specific operational context.
My honest advice: if your offshore staffing analysis only works under the best-case scenario, it is not ready. Build the model that survives the bad quarter, the unexpected attrition spike, and the communication breakdown. If it still shows positive ROI under those conditions, you have a real case for moving forward.
— Rajkumar
How Remotee simplifies your offshore hiring decision
Running a rigorous offshore staffing cost-benefit analysis is one thing. Finding the right talent to make those numbers real is another challenge entirely.

Remotee handles the parts of offshore hiring that quietly destroy cost models: compliance, payroll, HR management, and talent quality control. As an Employer of Record focused on India, Remotee removes the legal and administrative overhead that inflates year-one costs for most businesses. Clients report up to 32% savings on hiring costs, and Remotee’s screening process means you are selecting from pre-vetted, senior-caliber candidates rather than sorting through volume. If you are serious about the cost benefits of offshore staffing, start with a partner who has already solved the compliance and quality problems your model is trying to account for.
FAQ
What is a fully-loaded offshore labor cost?
A fully-loaded offshore labor cost includes base salary, statutory benefits, bonuses, equipment, software, and any employer-side taxes or contributions. It is the actual cost of an offshore hire, not just the hourly rate.
How long does it take for offshore staffing to break even?
For a single offshore engineer, break-even typically occurs between 10 and 12 weeks, after accounting for ramp-up productivity loss and initial overhead costs.
How much can offshore staffing realistically save?
Offshore staffing delivers 40–70% savings on fully-loaded labor costs compared to domestic hiring, with realistic savings of 55–65% after six months once total cost of ownership is factored in.
What is the biggest risk in an offshore staffing cost-benefit analysis?
Attrition is the most underestimated risk. Annual offshore attrition of 15–20% can reduce projected savings by 20–30% over three years if not explicitly modeled.
Does paying more for senior offshore talent actually lower costs?
Yes. Investing 25% more in senior offshore talent reduces bug-fix cycles by 40%, which lowers total cost of ownership and outperforms the lowest-cost option in most multi-year engagements.